Chapter 23: KPIs and Dashboards for Digital PR
Key Takeaways - KPIs bring clarity: Key Performance Indicators (KPIs) turn vague goals into specific, measurable targets. - Match KPIs to goals: The metrics you track must be directly related to your primary objective (Awareness, Engagement, SEO, or Leads). - Dashboards simplify reporting: A well-designed dashboard visualizes your most important KPIs for quick tracking. - Executives want insights: Lead with what the data means, not just what happened.
KPIs and dashboards are the tools you use to track and report on performance. A KPI is a specific number that shows how you are performing against a goal, while a dashboard is the visual interface that shows all your important numbers in one place. In the DPRI framework, the dashboard is your control panel for monitoring the health of your reputation and the effectiveness of your outreach.
Examples of Digital PR KPIs
- For Brand Awareness: Branded search volume, social media reach, and share of voice.
- For Engagement: Engagement rate and average time on page.
- For SEO: Number of new high-quality backlinks and keyword rankings.
- For Lead Generation: Newsletter sign-ups and conversion rates.
The Dashboard: Visualizing Success
A dashboard saves time and makes it easy to spot trends. A basic monthly report should show the current month's performance, the previous month's results, the percentage of change, and the goal you were aiming for.
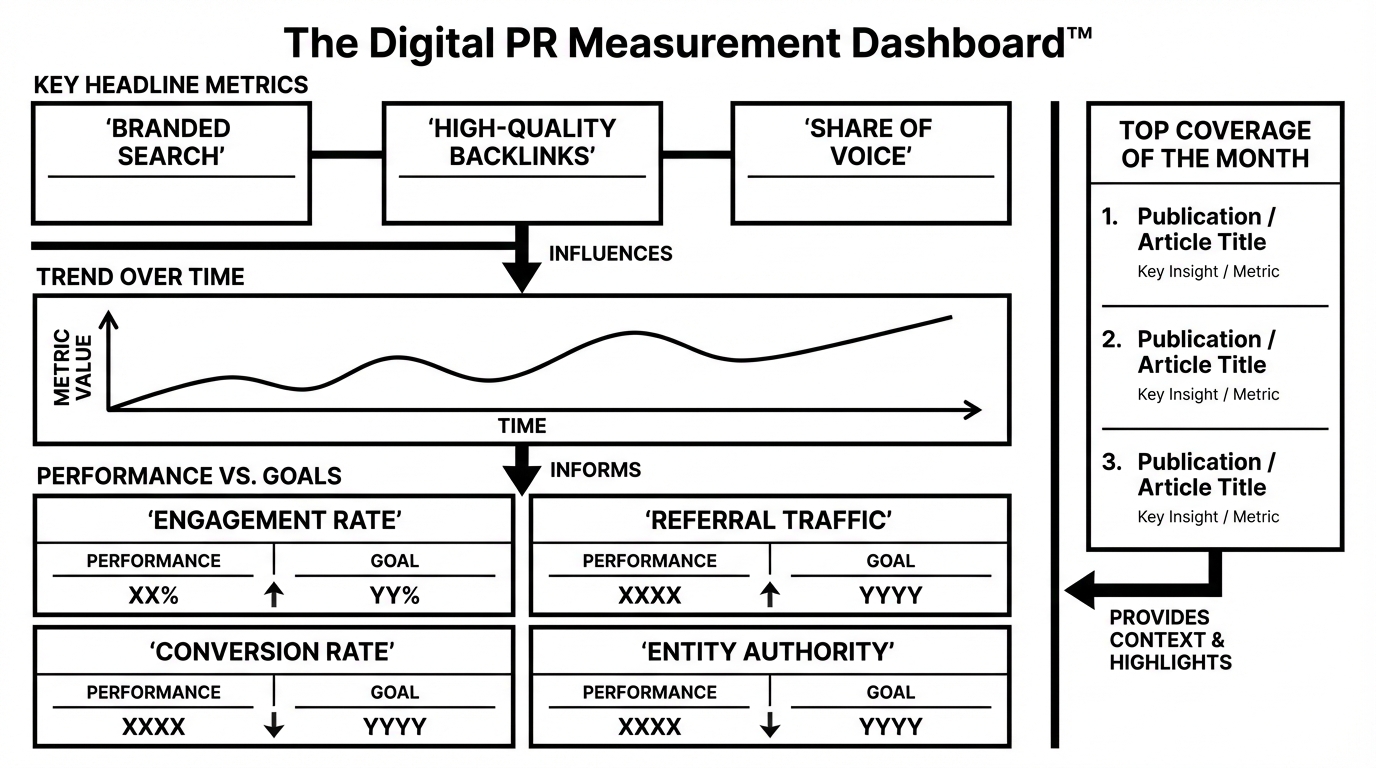
What to Include: - Keep it simple; do not track more than 6-8 KPIs per page. - Use charts to show trends over time. - Always provide context: how does this number compare to our goals?
Reporting to Leadership
Executives do not want data dumps; they want insights. A successful executive dashboard leads with a high-level summary of the total PR value generated that month, followed by highlights of top coverage and the resulting business pipeline.
Chapter 23 Toolkit: Tracking Your KPIs
Practical Exercises
Exercise 1: Dashboard Setup Using a tool like Looker Studio or a simple spreadsheet, create a one-page monthly dashboard. Include three headline numbers, one trend chart, and a section for the month's best piece of media coverage.
Exercise 2: Executive Summary Practice Take your last month of data and write a three-sentence summary. Sentence one should state the headline result; sentence two should explain what drove it; and sentence three should outline the next steps.
DPRI CONNECTION
Your dashboard should visualize the DPRI correlations that matter most for your objectives. An awareness campaign will highlight different metrics than a lead generation campaign, but both should be rooted in the 22 digital terms.
Next: Beyond standard dashboards lies advanced measurement. Chapter 24 explores attribution, the difference between outputs and outcomes, and the industry-standard Barcelona Principles.