Chapter 55: Campaign Measurement and Reporting Dashboard
Key Takeaways - Brevity is discipline: One-page reports are more likely to be read and understood by leadership. - Goals versus Reality: The comparison between targets and actual results is where the story lives. - Learnings drive growth: Document what worked and what failed to improve the next campaign.
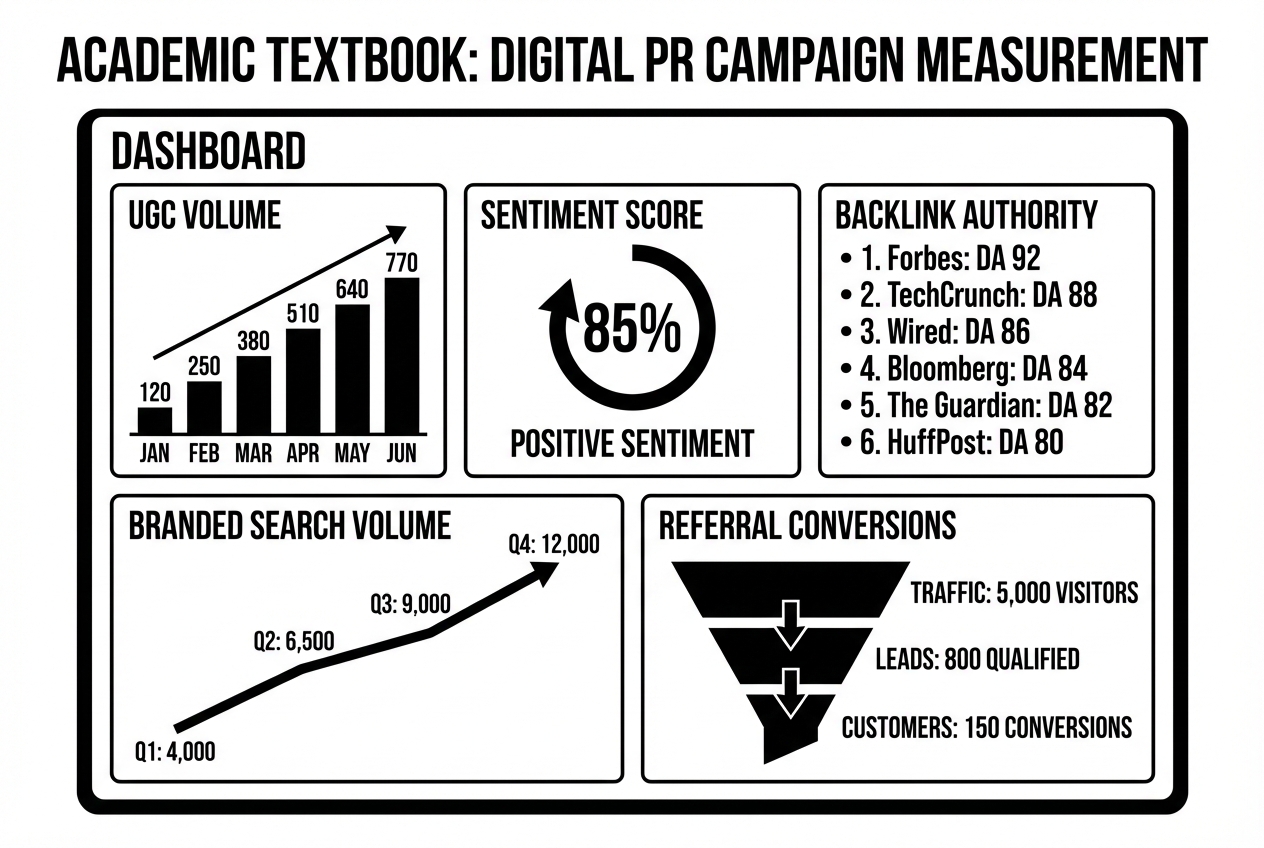
Measuring the impact of your work is essential for demonstrating value. This one-page template helps you report results clearly and concisely.
One-Page Campaign Report Structure
1. Executive Summary Restate the primary goal and list 2-3 key achievements. Summarize top-line results in media placements, traffic increase, and leads generated.
2. Performance Against KPIs
| KPI | Goal | Actual | Notes |
|---|---|---|---|
| Media Placements | 20 | 25 | Exceeded target |
| Share of Voice | 15% | 18% | Increased visibility |
| Website Referrals | 5,000 | 6,200 | Driven by tier-1 coverage |
| Social Engagement | 10% | 12% | High Reel performance |
3. Key Learnings and Recommendations Document what worked, what underperformed, and specifically what you will do differently in the next campaign.
DPRI CONNECTION
This dashboard completes Module 9 by operationalizing the 22 digital terms. It turns PR activity into documented business impact.
Module 9 Summary: You now have the templates for planning, outreach, global strategy, crisis management, and reporting. These tools are the practical implementation of the DPRI Method.
Next: Module 10 provides the MBA and Entrepreneur Toolkit—specialized resources for those building brands from the ground up.